Flightradar uses a RTL-SDR for receiving ADS-B data sent by MODE-S compatibile aircraft transponders. Frontend and backend for this project are available on Github. The frontend was partially copied from my Vatsim project (with significant modifications which mainly involved removing most of the features) while the backend was created from scratch using Go.
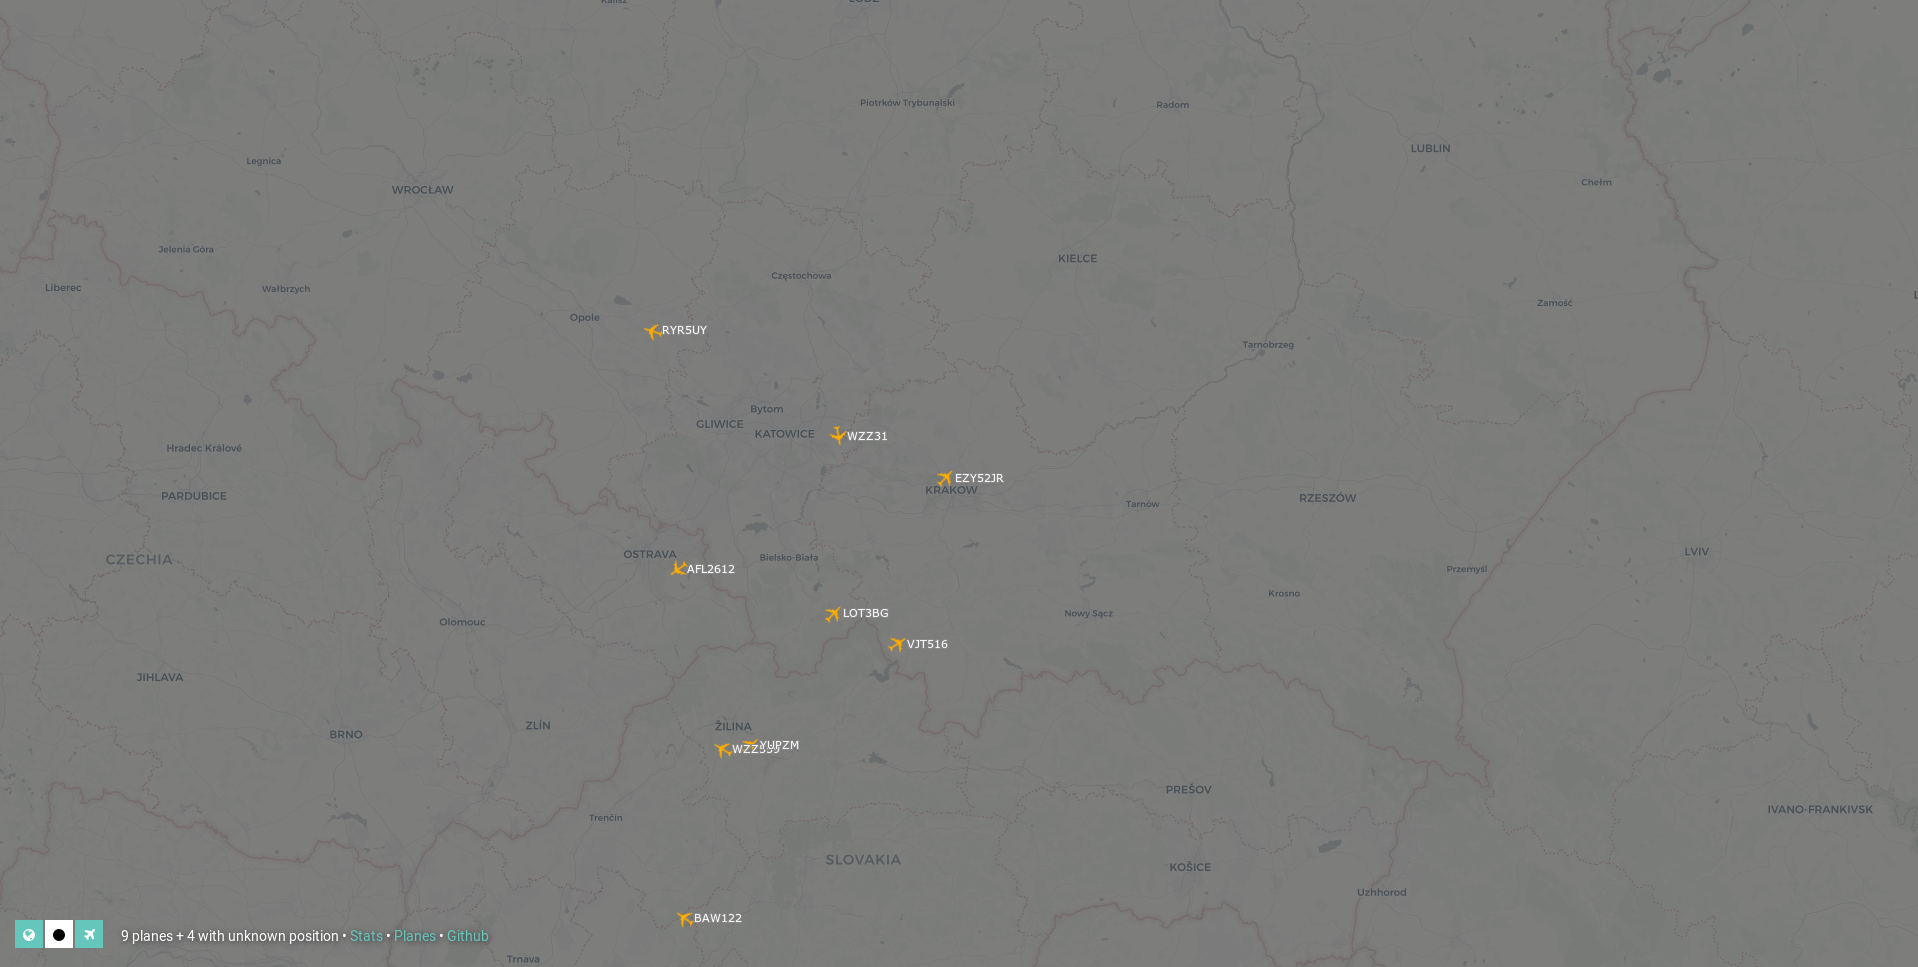
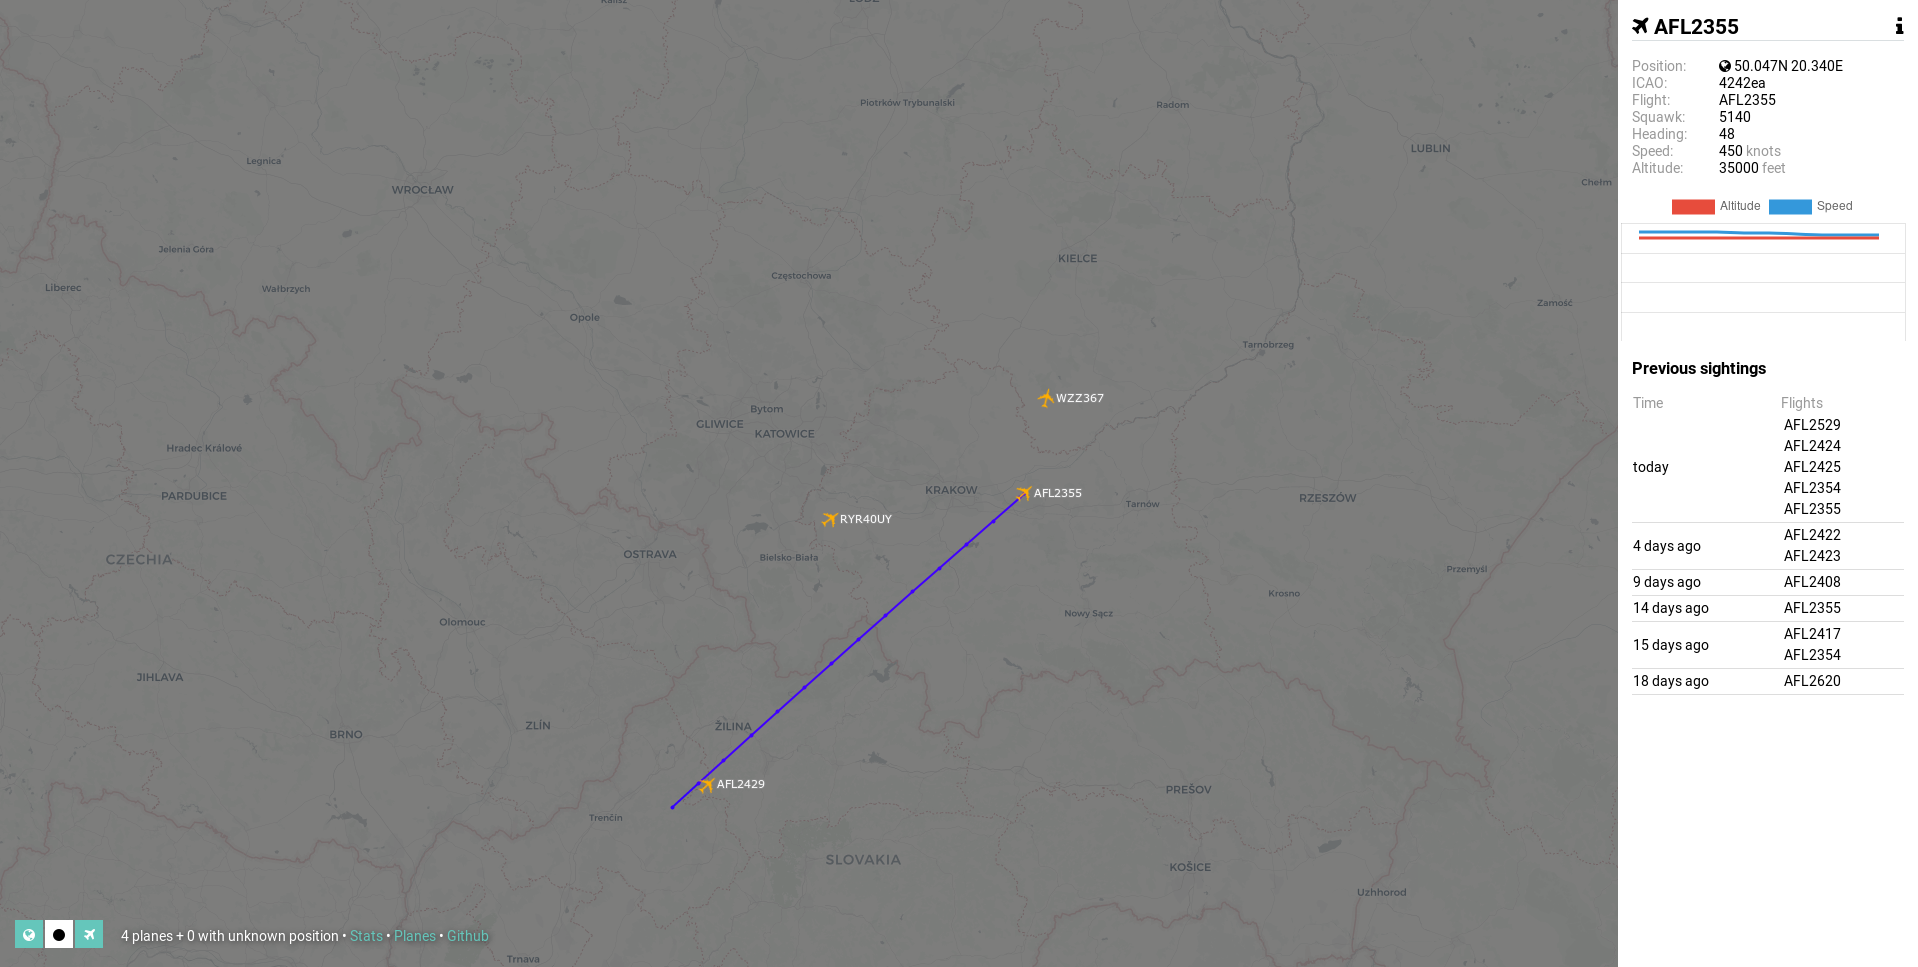
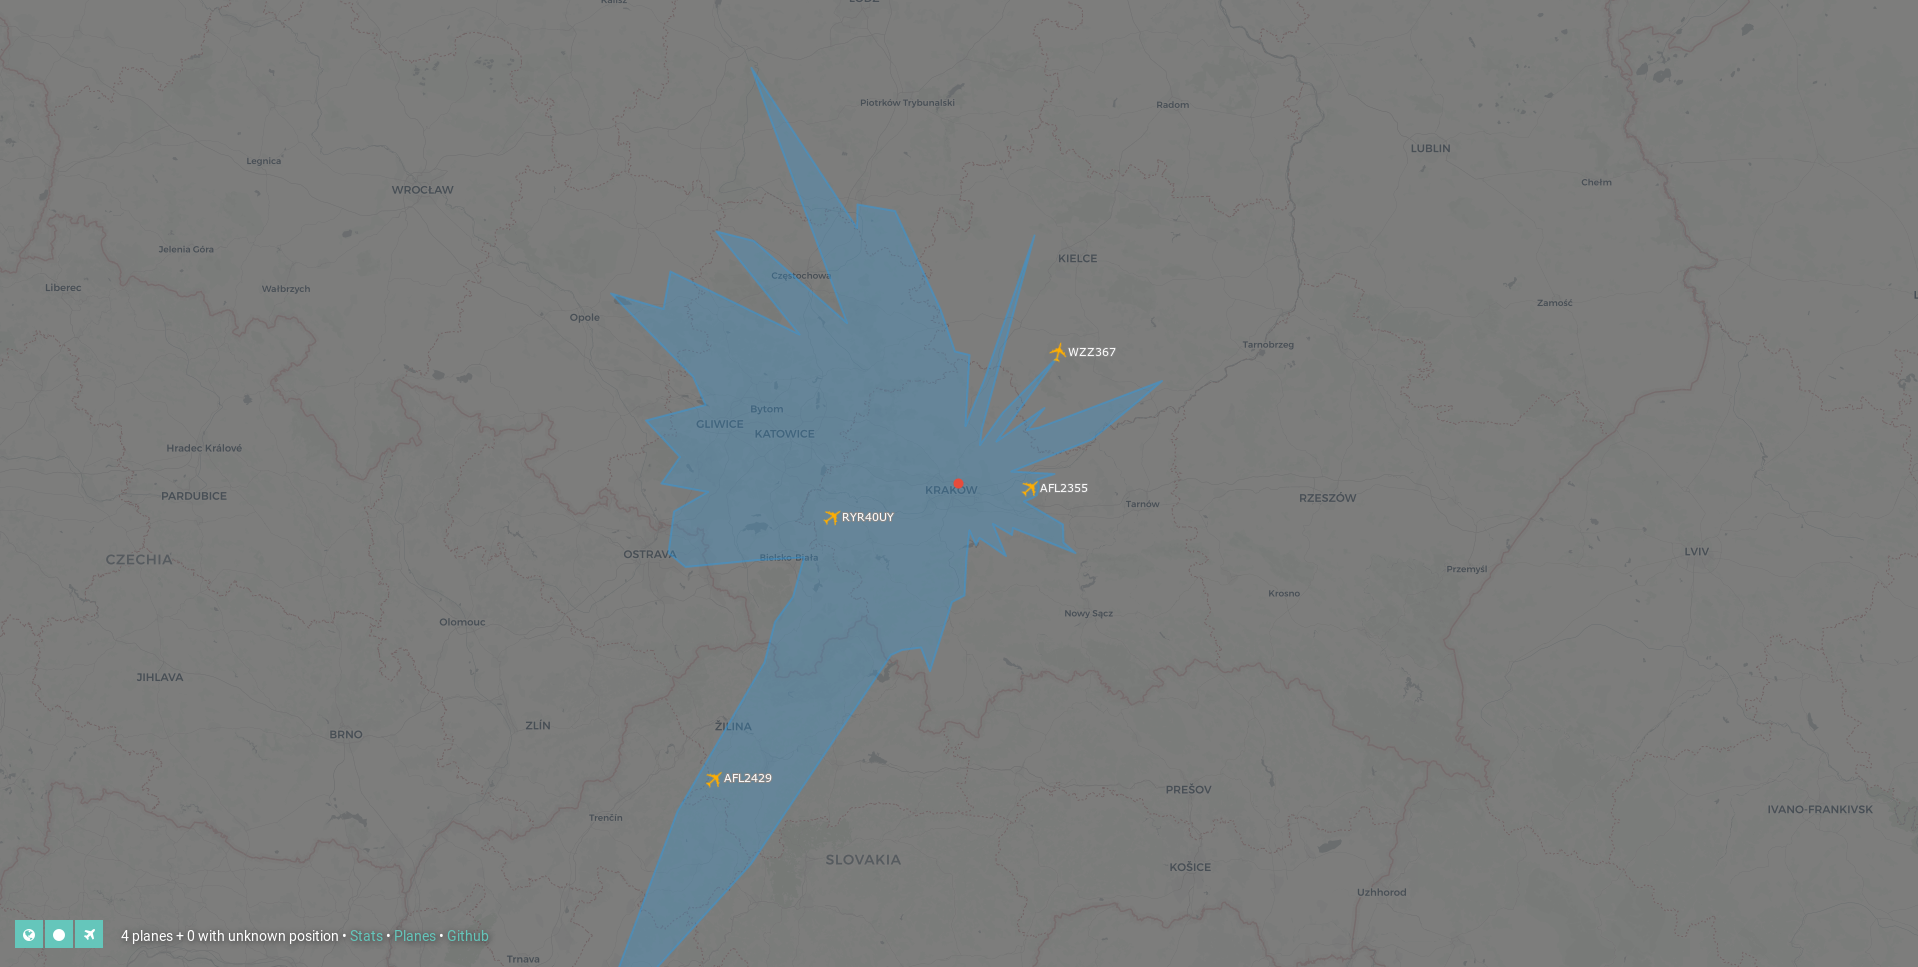
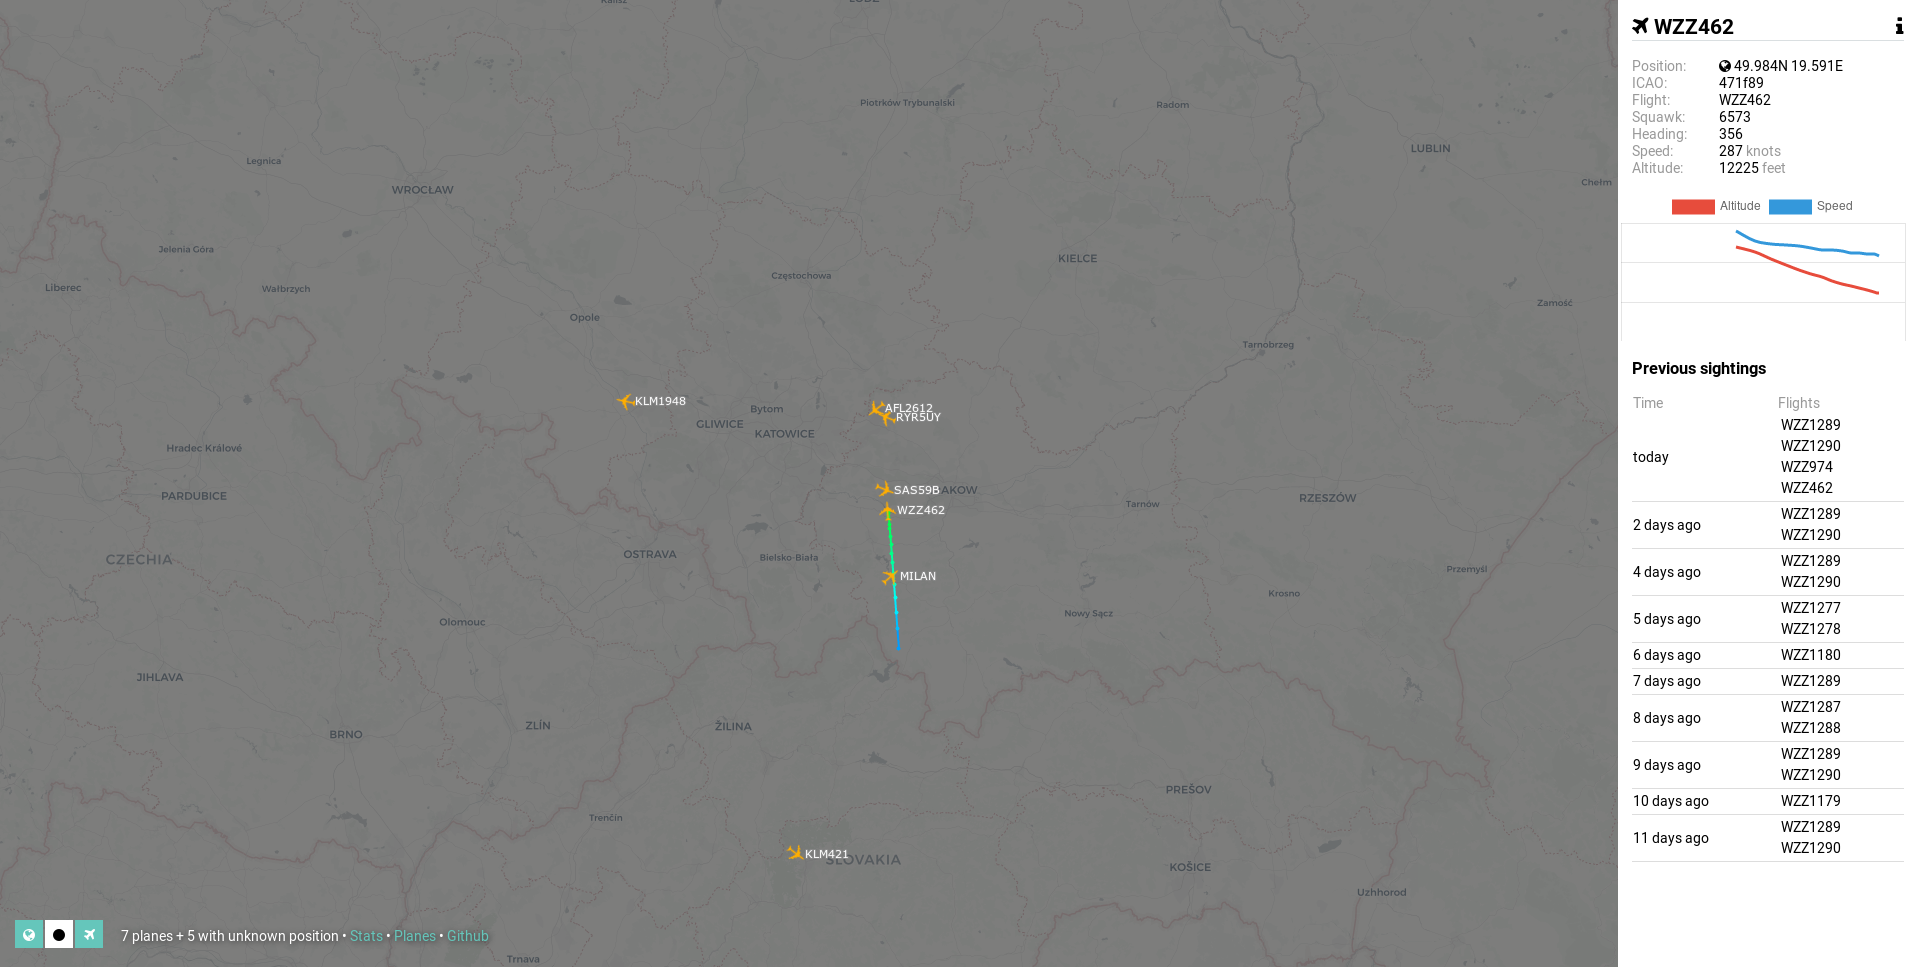
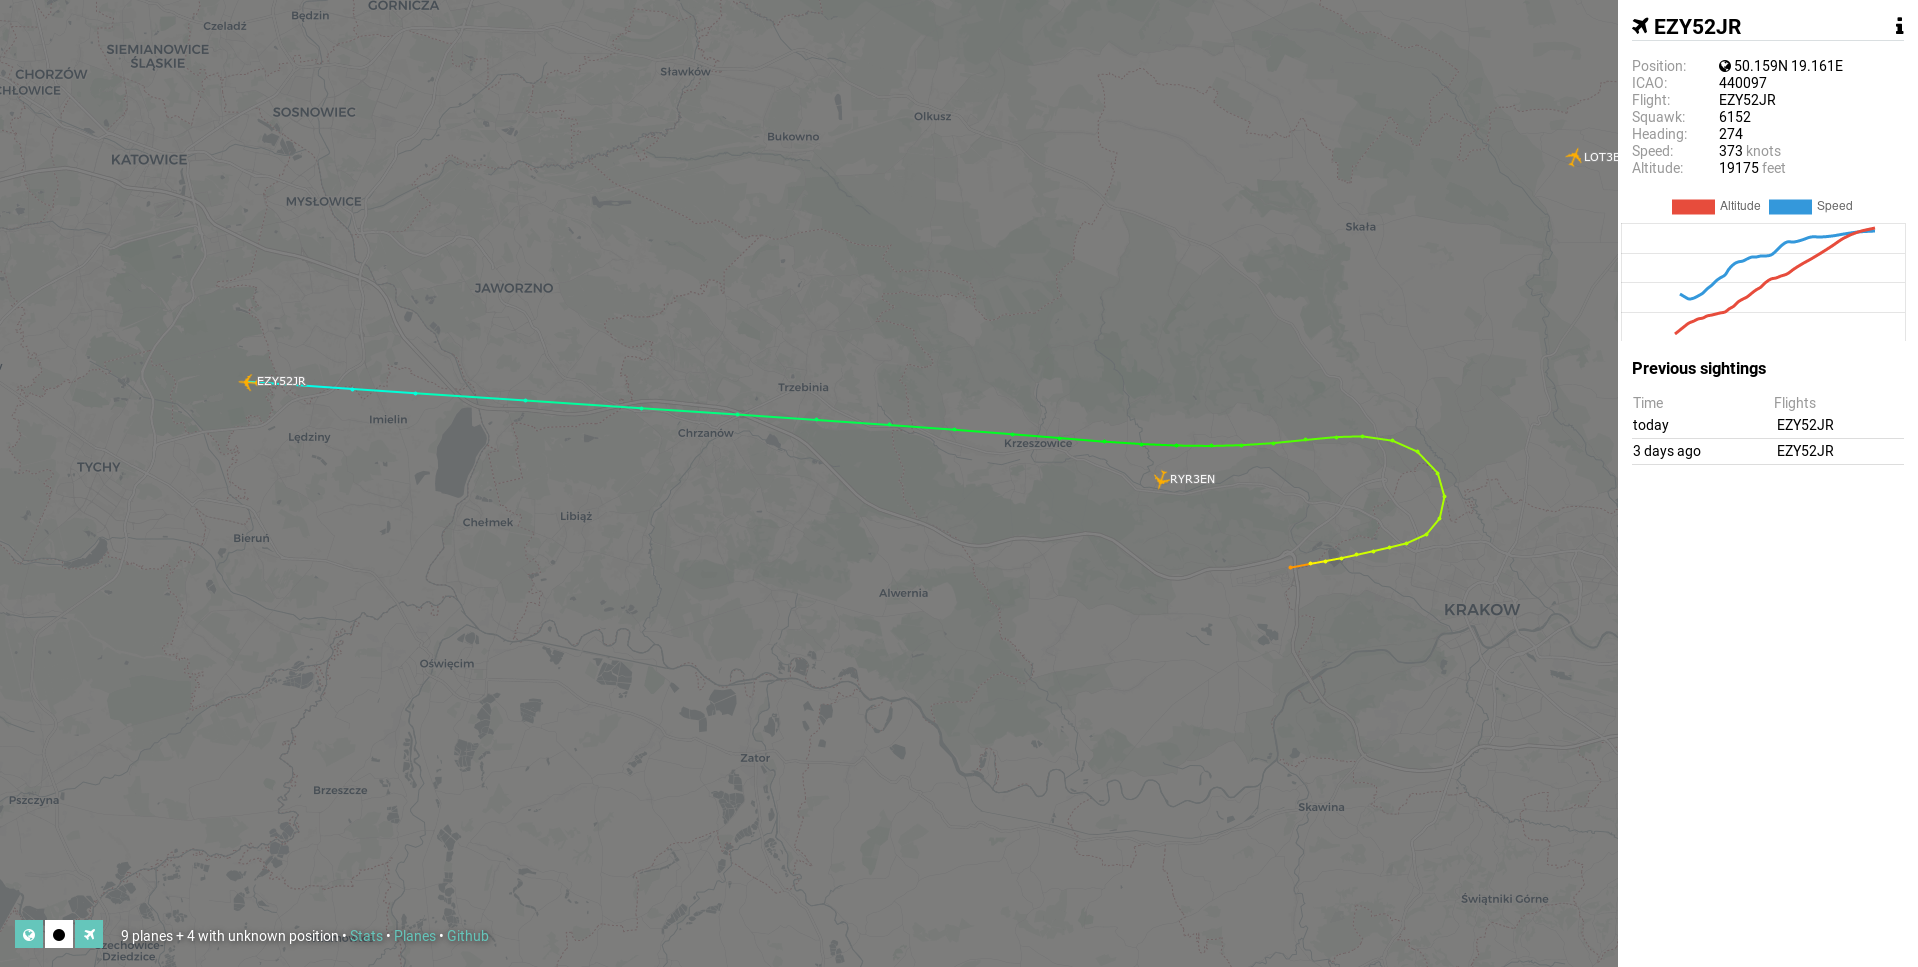
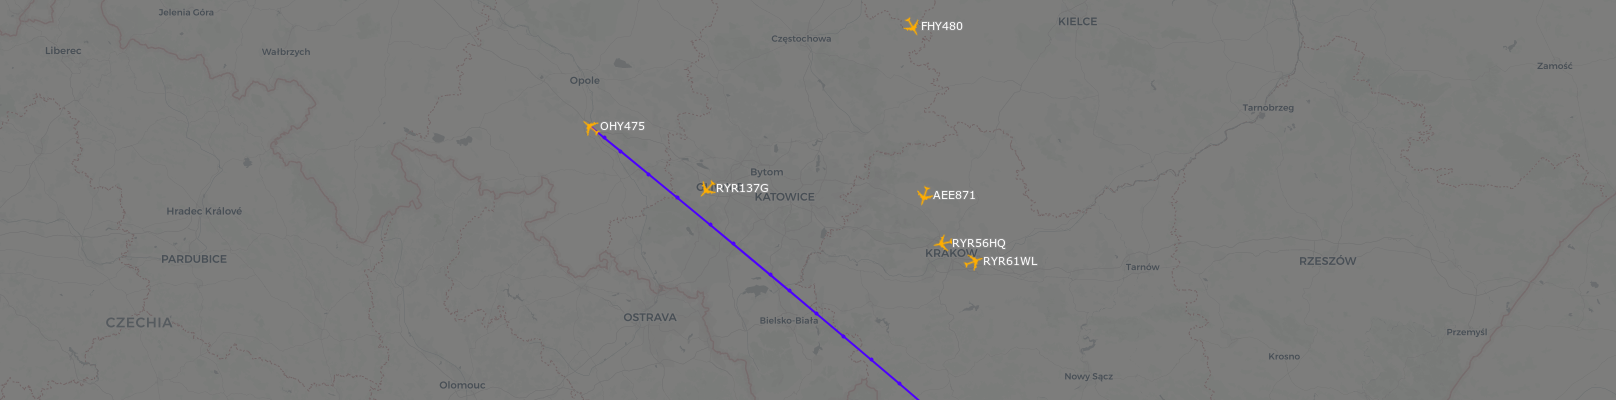
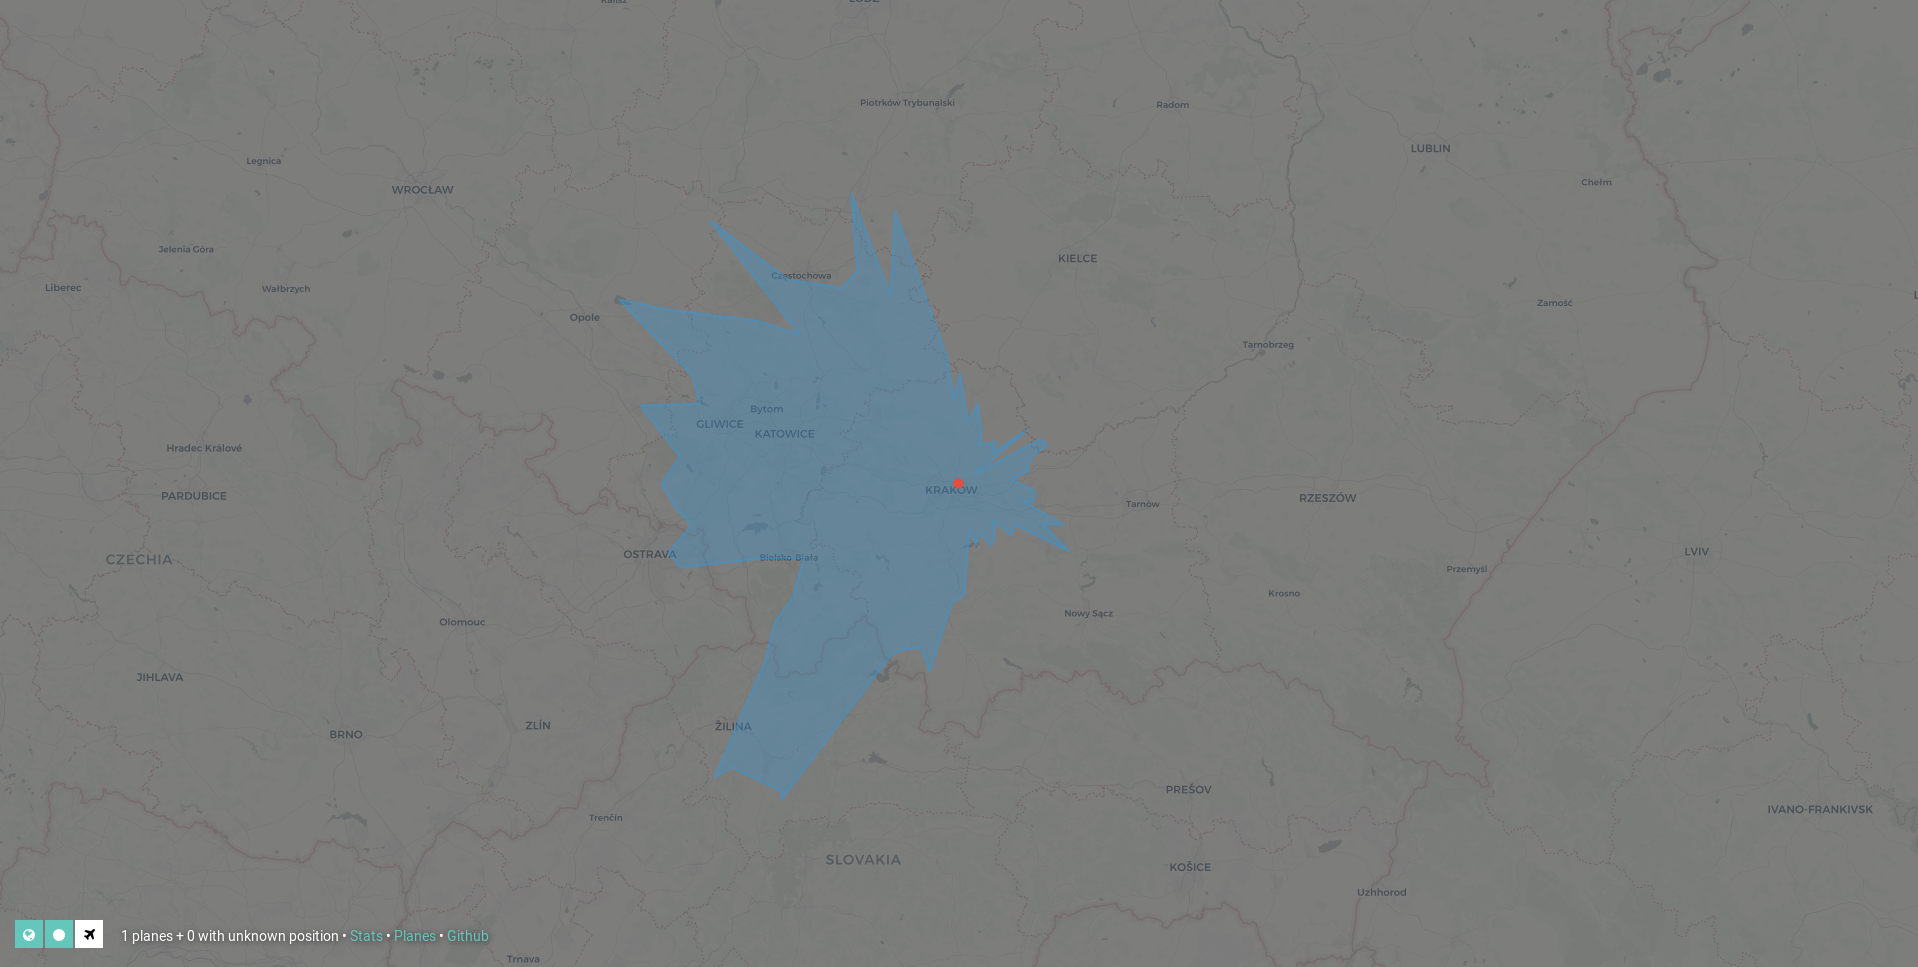
The live version of this project is available here. Click on the planes to see more details about them and click in the bottom left to toggle various map layers such as the polar range chart or see the statistics.
The Antenna
Personally I know nothing about designing antennas. If you also wish to read something that will completely go over your head I recommend a very comprehensive writeup available at http://www.antenna-theory.com/.
While initially I used the stock antenna that came with my SDR kit my goal was always to test different antenna configurations and eventually construct a custom weather-proofed antenna. I do not use additional amplifiers or filters since my reception range is mainly limited by the surrounding buildings obstructing my view of the horizon.
Due to the ADS-B frequency being 1090 MHz in the following sections you will often see measurements such as 69 mm which is 1/4 of the ADS-B wavelength.
The stock dipole antenna
At first my setup used a stock dipole antenna which was provided with my RTL-SDR kit described in the next section. The antenna is well constructed and comes with a tripod. I think that having it outside can however eventually cause corrosion due to the adverse weather conditions.

The cantenna
The cantenna was developed by the most secret cells of the underground ADS-B community. For reasons unknown to science and reason it outperforms many professional antennas. As demonstrated by the users on the linked websites it is very easy to weather-proof this antenna by adding a professional enclosure made out of highly specialized plastic bottle.

The SDR
For now I use a very basic kit available at the RTL-SDR community website. The kit is listed as "RTL-SDR Blog R820T2 RTL2832U 1PPM TCXO SMA Software Defined Radio with Dipole Antenna Kit" in the store available on the website.
If you wish to play with the SDR without using it for tracking aircraft I can recommend using a program called gqrx. Since it is relatively popular your Linux distribution should have the packages already available. Gqrx is good for beginners and works great when tuning in to the standard radio stations, aircraft traffic control, navaids such as VORs or other interesting radio sources.
Communicating with the SDR
In order to avoid implementing message decoding myself I use a fork of a popular dump1090 program. The program communicates with the SDR, parses the incoming ADS-B messages and exposes a web interface which can be used to retrieve the messages. The messages can also be printed directly to standard output and the program provides its own implementation of a realtime map, if you don't feel like writing your own version. Dump1090 is widely used and even the websites like Flightradar24 or FlightAware use it in their infrastructure. Unfortunately the original program is no longer maintained, and as of now the fork appears to be abandoned as well.
Processing the data
The backend which downloads the messages from dump1090 and stores them in a database has been written in Go. It exposes a JSON API used by the frontend which can be used to selectively retrieve the collected data points based on the time or involved aircraft.
Optimizing the backend and making it work relatively quickly on Raspberry Pi turned out to be the task taking the most of the time when writing this part of the project and required several changes to the initial design.
Picking the right database
Initially the backend stored the data in flat files. Each file contained JSON encoded data points separated by a newline character and the data for each plane was stored in a separate file. While this was an efficient approach when writing the data to the SD card the abysmal I/O performance of the Raspberry Pi quickly made reading the data in order to analyze it impossible with simple lookups taking over 30 seconds.
In order to mitigate that issue I decided to switch to using a relational database. To avoid running a fully featured database such as PosgreSQL on already struggling Raspberry Pi running a large number of other programs I decided to use SQLite3. I loaded the already existing data into the database and waited as more data was being collected. While initially the improvement was significant I quickly realised that for reasons unknown to me the database was not performing as well as I hoped. Despite all required indexes being present from the beginning after analyzing all of the queries that were being performed I couldn't find the reason for the poor performance other than the slow I/O. I also considered the possibility of the Go SQLite bindings underperforming for some reason but found no proof of that. SQLite also came with a different major issue that was a problem for me. Because the bindings (or actually the entire SQLite implementation - porting it is simply unrealistic) were using CGo, that is they were actually written in C, the cross-compilation for Raspberry Pi was annoyingly more complicated than simply running the go build command. At the same time the build times on Raspberry Pi jumped to almost thirty minutes after including the SQLite in my project. Because of that issue and the performance leaving much to be desired I decided to switch to a different database again.
After a couple of days and some searching I stumbled upon a very promising key/value store called Bolt. Bolt is written purely in Go which means that the cross-compilation process is extremly simple and at the same time offers a very good performance. After some testing I again imported the existing data into Bolt. The performance gain was significant however the database sizes quickly turned out to be rather large. While the SQLite database or even a simple JSON file with the exported data measured about 20MB at that time the Bolt database was 5 times larger at about 100MB. Using the tools provided by Bolt I quicky discovered that the large database size is related to the way the data points were distributed Bolt pages. A lot of the space that appeared to be wasted was actually unused. After running an official database-shrinking tool on my data I discovered that in fact it made the database even larger instead of shrinking it. After that failure I simply decided to pay the database size no attention. As it quickly turned out later on the database was not growing at such a quick rate anymore.
Replacing JSON
The second issue that was affecting the performance was related to data serialization and deserialization. As I mentioned earlier the data was being stored in the flat files and later on in the Bolt database in the JSON format. While profiling the backend I quickly discovered that while reading the data Raspberry Pi was spending a disproportional amount of time decoding JSON encoded data points. In order to improve the performance (and at the same time reduce the size of the database) I eventually decided to switch to much more efficient binary format Protocol Buffers developed by Google. While the API still uses JSON the performance impact is less significant there and JSON is rather hard to replace in public facing APIs due to its popularity and wide support.
Reducing the amount of collected data
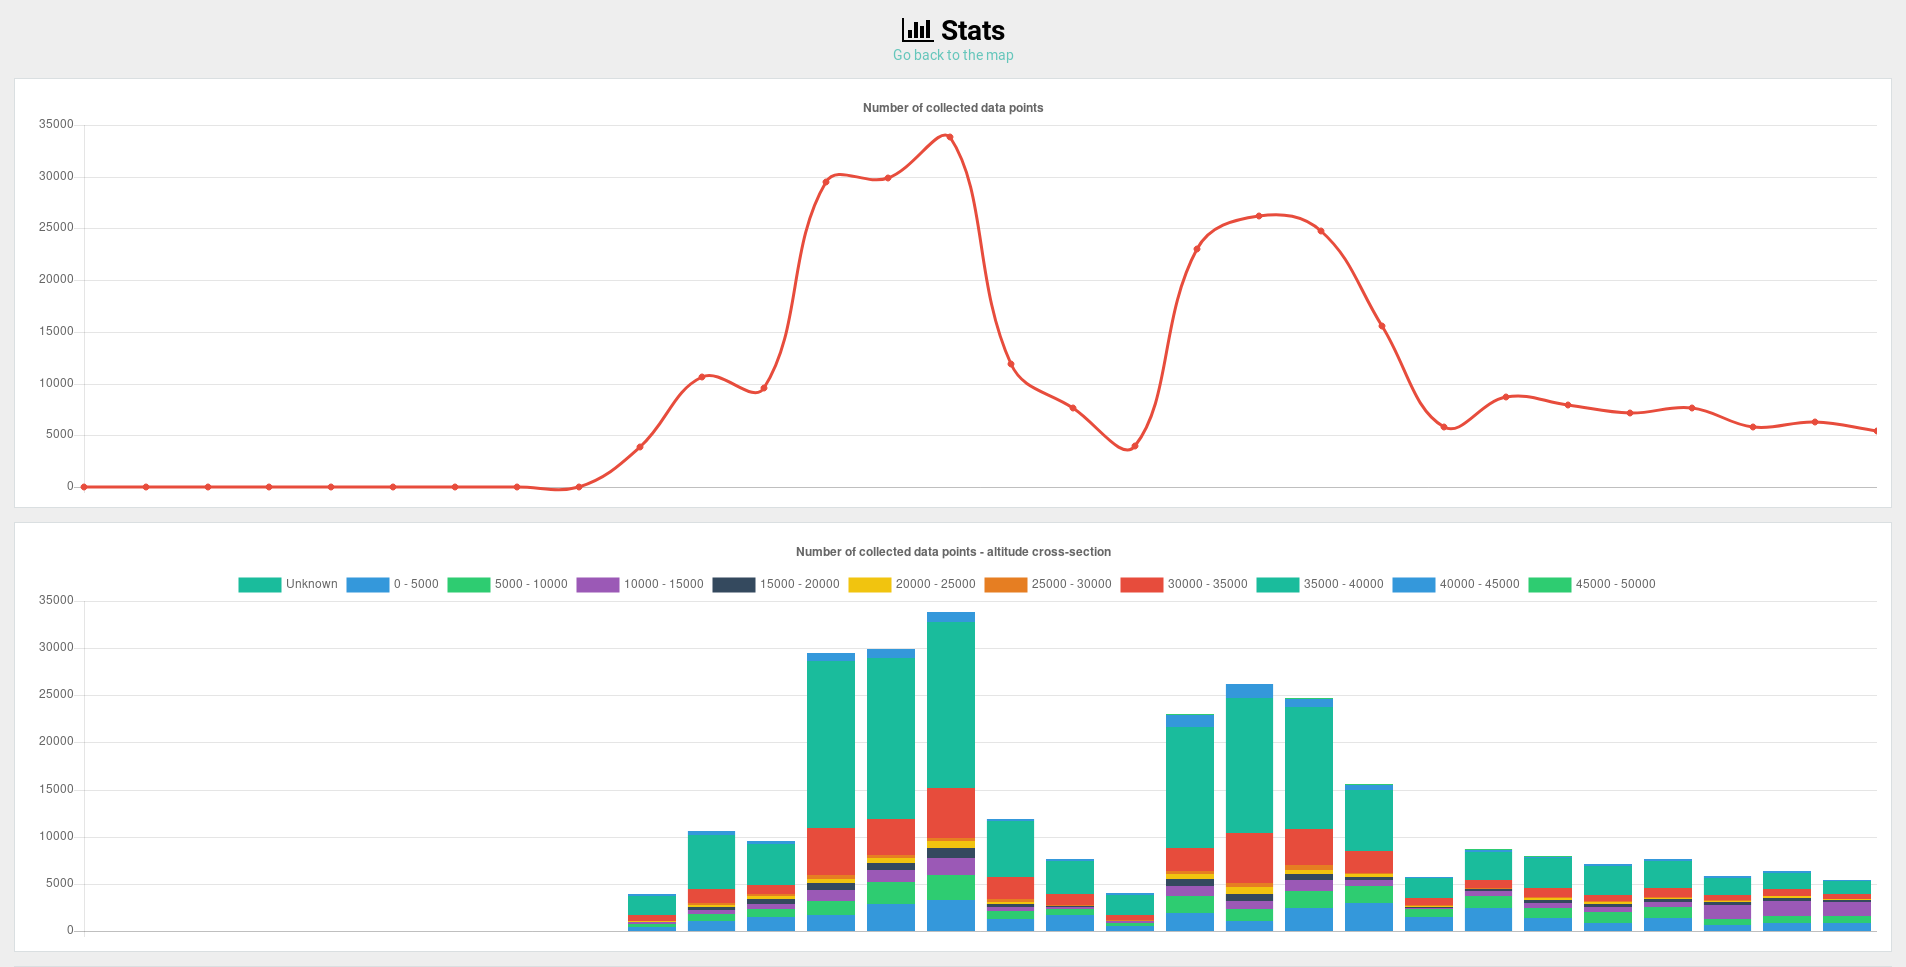
At first the backed was indiscriminately collecting data for each aircraft in 5 second intervals. After a couple of days it became clear that the backend is collecting about 30000-35000 data points per day and that the amount of collected that will quickly become unmanageable. In order to reduce the amount of data a series of optimizations had to be implemented.
The first optimization involved rejecting data points for which the position of the aircraft was identical to the one already stored. This issue is related to the fact that there is no way to check if the position (or anything else) was updated when downloading data from dump1090. In order to micromanage that it would be necessary to parse the standard output of the program which I am sure would quickly become annoying due to the large amount of different formats of printed ADS-B messages. This change led to reducing the amount of collected data points by about 20%.
The second optimization involved introducing different collection intervals for the aircraft going at different altitudes. As the aircraft at higher altitudes don't turn as sharply as the aircraft at lower altitudes there is no need to store all the excess data that they are generating. The data for aircraft flying above 30000 feet at some point consitituded about 80% of daily collected data points. Aiming to reduce that amount I introduced the following mapping of collection intervals to altitudes that led to further reduction in the total amount of collected data points by about 70%:
- every 5 seconds below 10000 feet
- every 10 seconds 10000-15000 feet
- every 15 seconds 15000-20000 feet
- every 20 seconds 20000-25000 feet
- every 25 seconds 25000-30000 feet
- every 30 seconds above 30000 feet
The last optimization involved replacing the discrete intervals for each altitude with a continuous function. Currently the altitudes between min and max altitude are mapped directly onto the times between min and max time. Adjusting the settings led to further reducing the number of collected data points on average by about 50%.
- min altitude: 10000
- max altitude: 30000
- min time: 10s
- max time: 60s
Trigonometric functions
After optimizing the database read times I was confident that calculating the polar range graphs will be a breeze. To my dismay I quickly discovered that when a large number of data points was being processed on a Raspberry Pi tasks which took miliseconds on my desktop required long minutes to complete. Convinced that the issue was database related I quickly created a simple tool for generating performance statistics and compared edge case scenario results from my desktop with those from Raspberry Pi:
    Desktop
       getRange: 162ms
         85% database: 137ms
         15% calculations: 25ms

    Raspberry Pi
       getRange: 3m47s
          5% database: 11s
         95% calculations: 3m35s
Not only did I discover that a task which required 162 miliseconds to run on my desktop took 3 minutes and 47 seconds to complete on Raspberry Pi but also realized that instead of being limited by the database performance my program spent 95% of that time just processing the retrieved data. A benchmark quickly revealed the problem:
  Showing top 25 nodes out of 26
      flat  flat%   sum%        cum   cum%
      (...)
     250ms 26.04% 51.04%      250ms 26.04%  math.cos /usr/lib/go/src/math/sin.go
      30ms  3.12% 54.17%      160ms 16.67%  math.atan2 /usr/lib/go/src/math/atan2.go
      30ms  3.12% 57.29%      130ms 13.54%  math.atan /usr/lib/go/src/math/atan.go
      40ms  4.17% 61.46%      110ms 11.46%  math.pow /usr/lib/go/src/math/pow.go
     100ms 10.42% 71.88%      100ms 10.42%  math.satan /usr/lib/go/src/math/atan.go
      80ms  8.33% 80.21%       80ms  8.33%  math.sin /usr/lib/go/src/math/sin.go
      50ms  5.21% 85.42%       50ms  5.21%  math.ldexp /usr/lib/go/src/math/ldexp.go
      (...)
My code performed a large amount of calculations related to distances and bearings on a sphere (in this case Earth). They involved using a significant number of relatively slow trigonometric functions - the algoritm calculated bearings and distances from the base station for each of the data points. I decided to partially replace the calculations with approximate functions using standard Euclidean geometry. Currently only after the values for all points are precalculated using Euclidean calculations the distances for points of interest are recalculated using accurate methods. Obviously Euclidean calculations are completely inaccurate but they do a good job when simply comparing relative distances and could even be replaced by a series of conditional statements when comparing points which lie on the same bearing from the base station. This is the previously shown edge case performance report after removing as many trigonomeric functions as possible:
    Raspberry Pi
       getRange: 31s
         41% database: 12s
         59% calculations: 19s
A total average reduction in execution time averages 85%.
Future performance
Even though the backend is currently usable (albeit slow) I expect more performance related problems in the future. Even now displaying range graphs is painfully slow but I am worried that it might simply be one of the joys of using a Raspberry Pi. As spending all the time on optimizing the performance instead of adding more instresting features to the project is rarely interesting (as illustrated by many popular programs that we encounter every day) currently I am quite patient even when I have to wait 10 seconds for the data to appear on my screen. More optimization will unfortunarely likely be required if the reception range improves and more data will be collected.
A backend repository can be found here.
Presenting the data
The frontend communicates with the backend using a JSON API and displays a real time map of the tracked aircraft, short flight history for each aircraft, a list of the last sightings of the given aircraft, a range graph which displays the furthest detections in every direction for a given time range and other useful information. While at first the frontend was very rudimentary and didn't use any major frameworks apart from a few libraries such as jQuery or OpenLayers the current version was built using Angular 5. The reasons for using Angular were mainly related to mounting technological challenges caused by writing a complex single-page application using only jQuery. The initial concept called only for a map with minor elements appearing around it from time to time, a task for which jQuery was an appropriate library. Eventually however I decided to add multiple subpages and more features to the project which led to the codebase being simply unmanageable. Among the interesting libraries that I've used and which I can recommend as being extremly useful are a simple and at the same time powerful charting library Chart.js and previously mentioned mapping libary OpenLayers which comes with a huge amount of useful features and customizability.
The map tiles that I've used are rendered based on the data from amazing Open Street Map. While at first I did use the standard Open Street Map tiles the text and a large number of features caused the planes to often be hard to notice. Because of that I decided to switch to freely available tiles provided by Carto. Currently the map is using tiles called "Positron" which come with a dark alternative named "Dark matter". To make the Positron tiles darker they are simply rendered with 50% transparency over a black background. A large number of other tiles based on Open Street Map can be found on the Open Street Map wiki or simply by searching online. The Open Street Map wiki is also very useful to learn about web maps and mapping in general.
A frontend repository can be found here.